






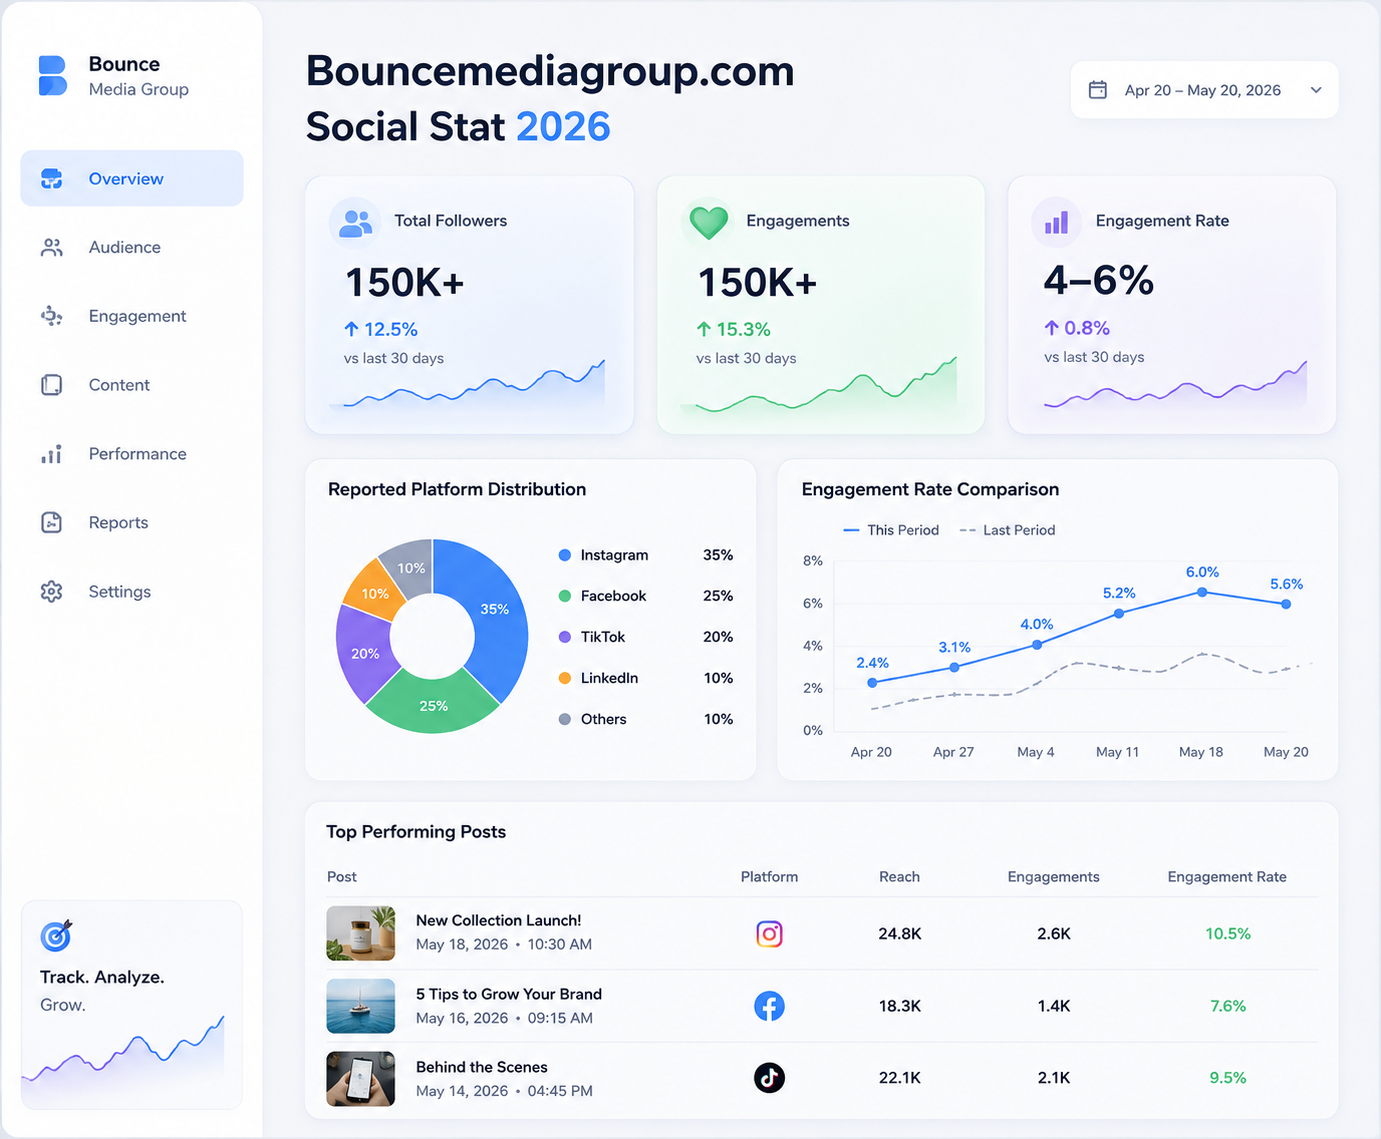
Open any dashboard today and you’ll be staring at a wall of numbers within seconds. Likes, shares, saves, watch time, click-through rate — it’s a lot. But here’s the thing most people miss: social stats aren’t the goal. They’re a mirror. They show you, in painfully honest detail, whether what you’re posting is actually landing with real people.
If you’ve ever felt like you’re drowning in metrics but still can’t answer the simple question “is this working?” — this one’s for you.
Why Most People Misread Their Social Stats
The biggest mistake isn’t a lack of data. It’s treating every number as equally important. A brand might obsess over follower count while ignoring the fact that their engagement rate has quietly dropped by half over three months. That’s like celebrating a full parking lot while the store inside is empty.
Good social stats tell a layered story. Reach tells you who saw something. Engagement tells you who cared. Conversion tells you who acted. When you only look at one layer, you get a distorted picture — and distorted pictures lead to bad decisions, like doubling down on content that looks good on paper but does nothing for the business.
Take a small skincare brand as an example. Their Instagram Reels were racking up hundreds of thousands of views every week. Leadership was thrilled — the social stats looked incredible on a slide deck. But sales hadn’t moved. When they dug into the comments and saved-post data, they found most viewers were there for the aesthetic, not the product. The views were real, but they weren’t the right audience. Once the brand adjusted messaging to speak directly to buyers instead of just entertaining scrollers, conversions climbed even though raw view counts actually dropped.
The Metrics That Actually Move the Needle
Not every stat deserves your attention. Here are the ones worth tracking closely, and why.
Engagement rate — This is your truest measure of relevance. A post with 10,000 views and 50 interactions is weaker than one with 2,000 views and 300 interactions. Percentage matters more than raw volume.
Saves and shares — These are the quiet signals people underrate. A like takes half a second and means almost nothing. A save means someone wants to come back to it. A share means they’re willing to put their own reputation behind your content. Track these separately from likes if your platform lets you.
Follower growth rate vs. churn — Gaining 500 followers a week feels great until you notice you’re also losing 400. Net growth, not gross growth, is the number that matters for long-term audience building.
Click-through rate (CTR) — This is where curiosity turns into action. If your social stats show strong reach but weak CTR, your content is entertaining but not persuasive enough to move people off the platform.
Watch time and completion rate — For video-heavy platforms, this tells you if people are actually consuming your message or bailing three seconds in. A 15-second video watched to completion beats a 60-second video abandoned halfway through.
A regional fitness studio I came across leaned heavily on this last point. They noticed their workout tip videos had strong initial views but a steep drop-off around the eight-second mark. Instead of assuming the content topic was wrong, they tested shorter hooks and faster pacing. Completion rates nearly doubled, and bookings from social media rose the following month. The lesson: sometimes the fix isn’t what you’re saying, it’s how fast you get to the point.
How to Turn Raw Numbers Into a Real Strategy
Collecting social stats is easy. Acting on them is where most teams fall short. Here’s a simple approach that works regardless of platform or industry.
Start with a baseline. You can’t judge improvement without knowing where you started. Pull your last 90 days of data before making any changes, so you have something honest to compare against.
Segment by content type, not just by post. Group your posts into categories — educational, promotional, behind-the-scenes, entertainment — and compare average engagement rate across each group. This often reveals patterns that a post-by-post view hides completely.
Watch trends, not single data points. One viral post doesn’t mean you’ve cracked the code, and one flop doesn’t mean the strategy failed. Look at rolling averages over weeks, not isolated spikes.
Connect stats to business outcomes. Engagement is a proxy, not the finish line. Tie your social stats to newsletter signups, website visits, or actual sales wherever you can. A local bakery I know tracks which Instagram posts drive the most “I saw this online” mentions at checkout — a low-tech but surprisingly effective way to connect content to revenue.
Review monthly, adjust quarterly. Daily obsessing over numbers leads to reactive, jumpy decisions. Give your content enough runway to actually perform before judging it.
Common Traps When Reading Social Stats
Even experienced marketers fall into a few recurring traps.
One is chasing vanity numbers. Follower count looks impressive in a pitch deck, but it rarely correlates with revenue on its own. A tightly engaged audience of 5,000 will often outperform a passive audience of 50,000.
Another trap is ignoring context. A dip in engagement during a major news event or holiday week isn’t necessarily a sign your content is failing — it might just reflect a distracted audience. Comparing that week to a “normal” week without adjusting for context leads to false conclusions.
A third trap is benchmarking against the wrong competitors. Comparing your numbers to a massive global brand with a ten-person social team and a paid media budget isn’t useful if you’re a five-person local business. Benchmark against accounts similar in size, industry, and audience.
Finally, there’s the trap of treating every platform the same. A strong engagement rate on TikTok looks completely different from a strong engagement rate on LinkedIn. Cross-platform comparisons without adjusting expectations will make perfectly healthy accounts look like they’re underperforming.
Making Social Stats Work for You Long-Term
The brands that win with social data aren’t the ones with the fanciest dashboards. They’re the ones who ask better questions of their numbers. Instead of “how many people saw this,” they ask “who saw this, did they care, and did it move them closer to something meaningful.” That shift in mindset changes everything about how you plan content.
Set a recurring habit — even just fifteen minutes a week — to actually sit with your numbers instead of glancing at them. Note what surprised you. Note what confirmed what you already suspected. Over time, that habit builds an instinct for your audience that no dashboard alone can give you.
Social stats will keep evolving as platforms change their algorithms and introduce new metrics. But the underlying discipline stays the same: measure what matters, ignore what doesn’t, and always tie the numbers back to real human behavior. Do that consistently, and your social stats stop being a source of anxiety and start becoming one of your most useful business tools.
read more trending blogs on world daily drift.